
Predicting readmission of diabetic patients
Hospital readmissions for diabetic patients pose a significant challenge to healthcare systems, contributing to increased costs and poorer patient outcomes...

My name is Ruth Kitasi, a results-oriented Data Analytics and Data Science professional with a Bachelor’s degree in Business Information Technology and over five years of experience in translating data into meaningful solutions.
I currently serve as a Data Executive at Africa Health Business, where I leverage data and analytics to optimise internal operations, monitor and evaluate programs,and drive evidence-based strategies that assist clients exploring and entering the healthcare market in Kenya and across Africa.
Proficient in Python, SQL, Power BI, Looker, and Advanced Excel, I manage the end-to-end data lifecycle, from automated cleaning and database integration, to the delivery of interactive dashboards.
My work has improved the decision making process by 30% and contributed data-driven insights to projects focused on healthcare system strengthening, reinfocing partnerships with major health organizations.
Passionate about using data to drive meaningful impact, I analyze public datasets and share insights on digital professional platforms, fostering collaboration in the data and AI space.
Hospital readmissions for diabetic patients pose a significant challenge to healthcare systems, contributing to increased costs and poorer patient outcomes...
Advancements in data analytics and machine learning have opened new frontiers in healthcare, allowing practitioners to harness existing health data to predict potential risks....
In today’s digital era, data has become the fuel that propels business operations...
As Africa experiences advancements in technology and a growing need for more efficient and effective healthcare systems, data plays a crucial role in ...

I came across a post on LinkedIn “world obesity day” advocating for a healthy lifestyle. In the past, I held the misconception that obesity was primarily a concern in Western societies...
As January marks cervical cancer awareness month, it prompts a reflection of this common yet often misunderstood form of cancer. but what significance does this hold for Africa?
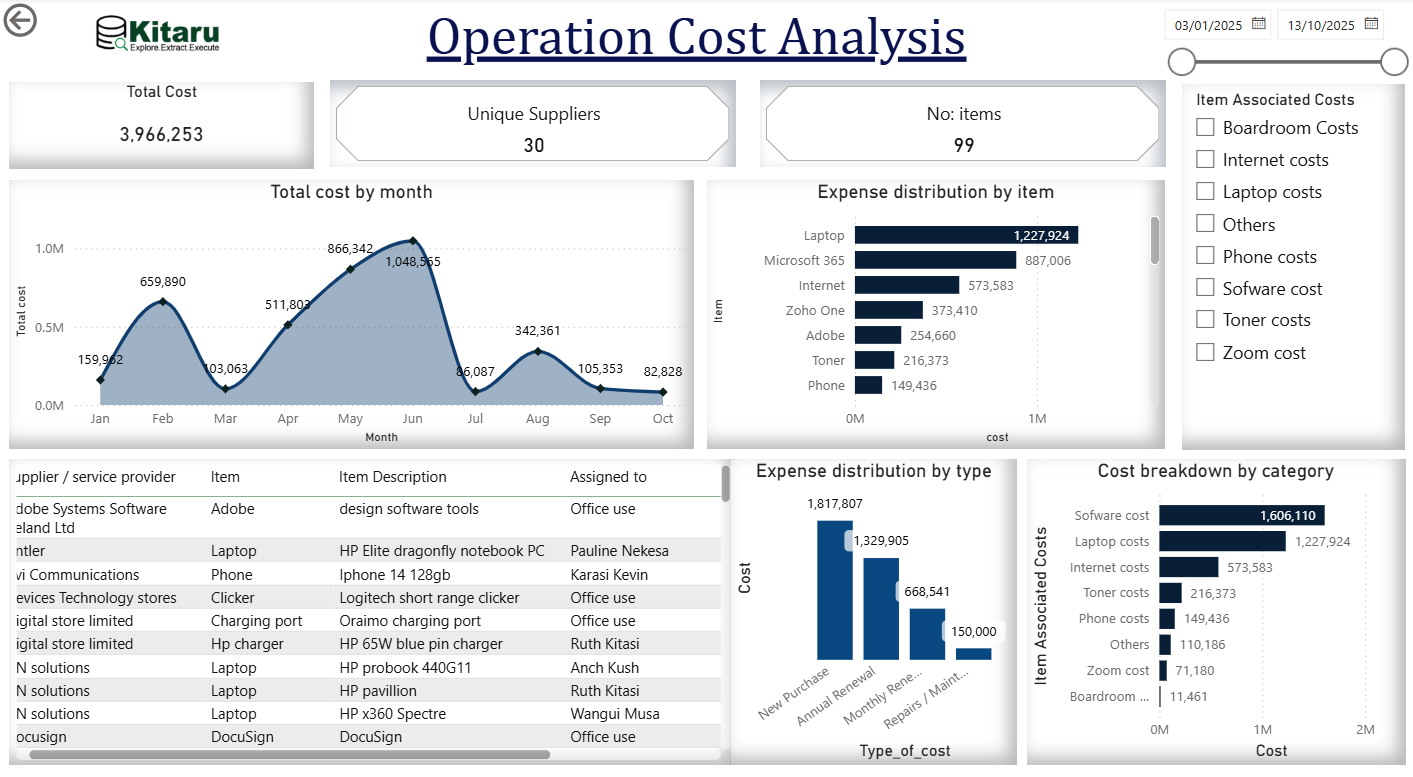
This Power BI dashboard provides a comprehensive overview of ICT-related operational expenses, enabling data-driven decision-making and cost optimization. It tracks new purchases, renewals, and maintenance costs over time, offering insights into spending trends, budget allocation, and cost efficiency across departments. The dashboard simplifies financial monitoring and supports transparency in ICT expenditure management.
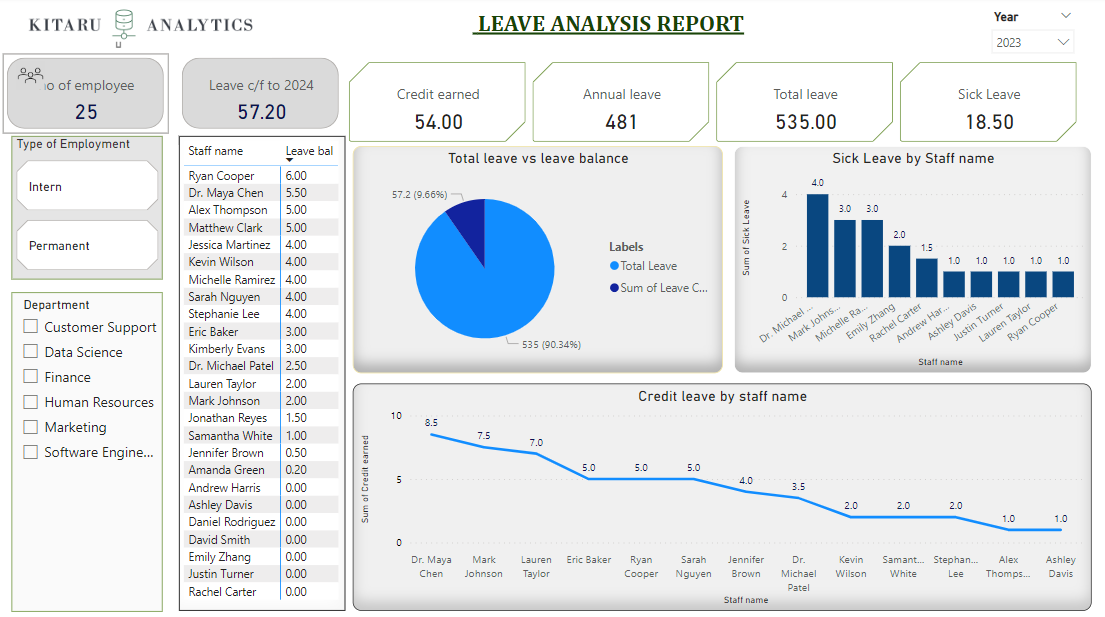
This Power BI report provides a comprehensive overview of employee leave trends across departments and time periods. It tracks key metrics such as total leave days taken, leave balance, leave type distribution, and departmental comparisons. Interactive visuals and filters allow users to analyze patterns, identify high leave periods, and support data-driven decisions for workforce planning and attendance managemen
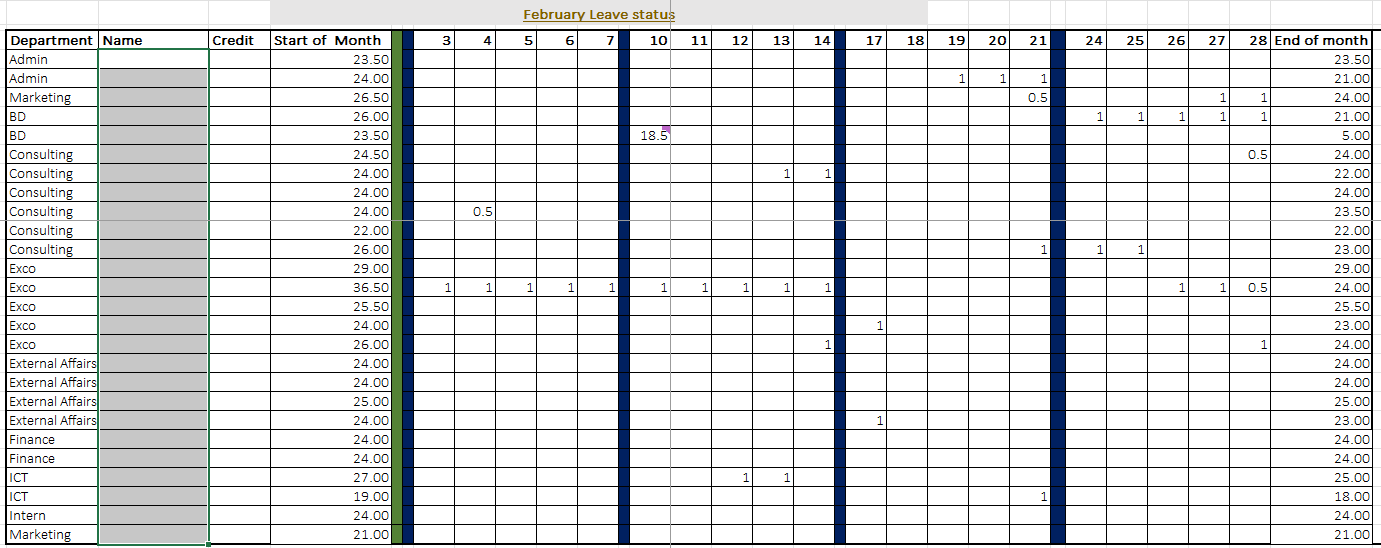
Designed an automated leave management workflow in Excel to streamline the leave application and approval process. The workflow uses formulas, data validation, and conditional formatting to track leave requests, approvals, and balances efficiently — showcasing skills in Excel automation, logical structuring, and workflow design.
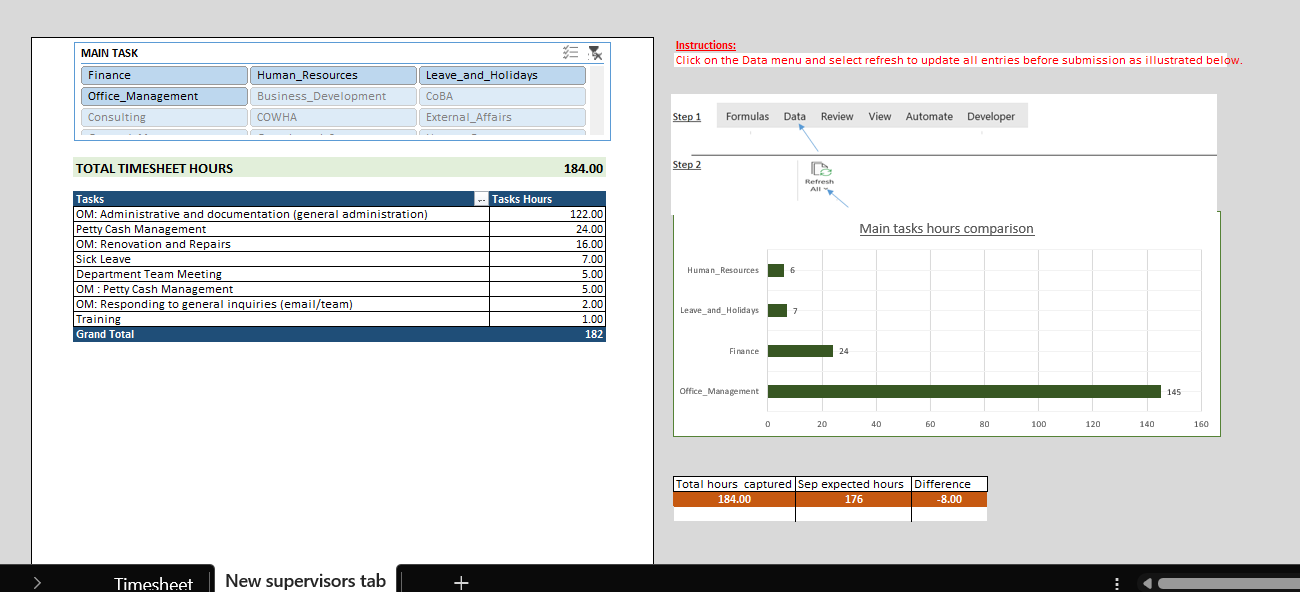
Developed an Excel-based timesheet system to capture employee details, daily tasks, and working hours. The tool automatically generates a summary report of tasks and time spent, improving visibility into team productivity and project allocation. This project highlights skills in Excel data management, reporting, and automation
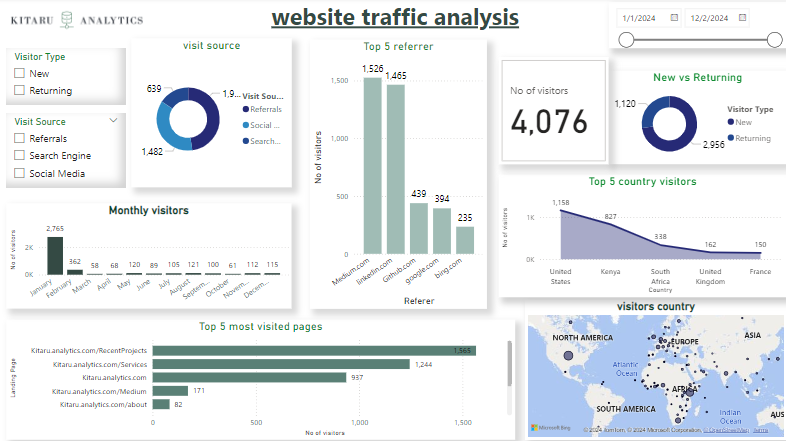
This Power BI report tracks website visits, page views, visitor demographics, referral sources, and countries of origin. It provides a clear view of audience behavior and traffic patterns, helping to identify where visitors come from and which pages attract the most engagement
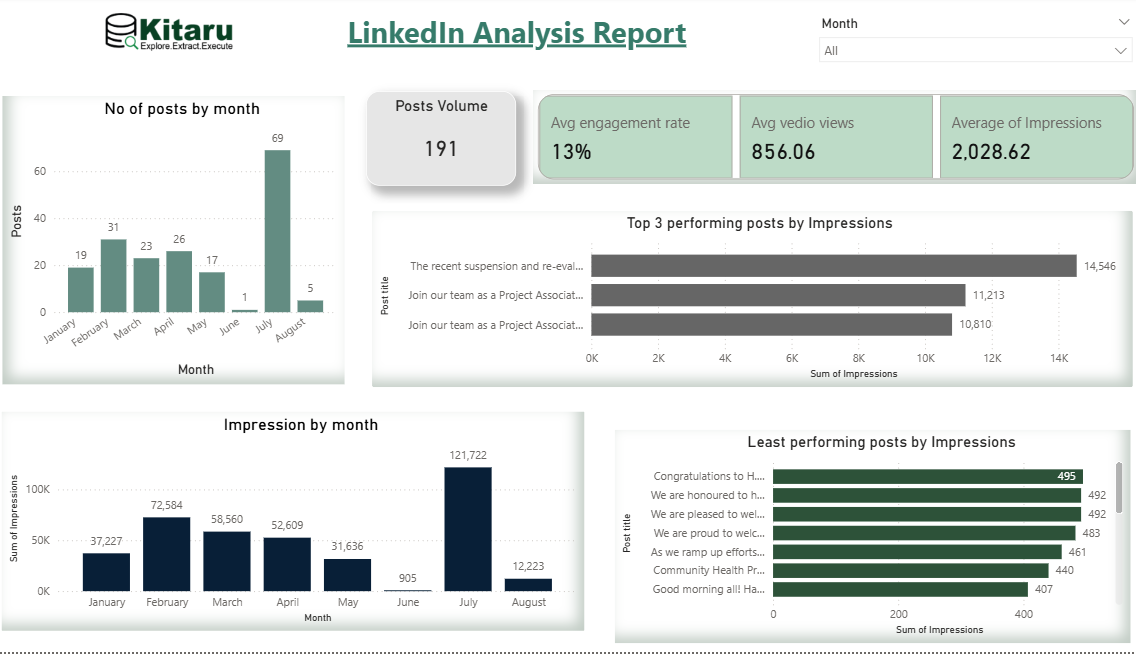
This Power BI report analyzes LinkedIn engagement metrics, tracking post impressions, reactions, comments, and follower growth over time. It provides insights into content performance and audience trends to help optimize posting strategy and boost visibility.